Map Data
2015.01.28 - 
We’re always looking for ways to make better decisions using data. We previously posted map balance data, and it’s time for an update! Below you’ll find some current statistics for the Active Duty map pool.
Some maps, like Dust2, have not changed much since our previous post. Others, like Cobblestone and Overpass, have changed dramatically. Check out the results below, and let us know what you think!
OVERALL ROUND OUTCOMES
The round results below show the likelihood of the T (orange) or CT (blue) side winning a round, using data collected over the past month from the highest skill groups in competitive matchmaking.
Click here for a full dataset that breaks down each map by skill group.
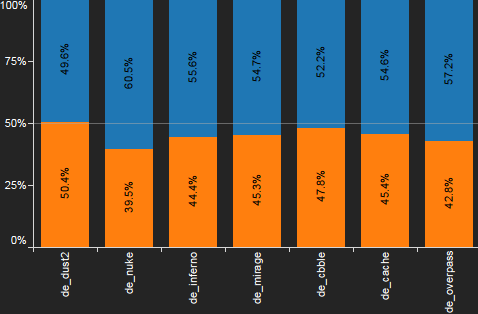
Overall round outcomes are a broad first-pass, but we can already see some interesting trends – Dust2, Cache and Cobblestone tend to produce similar results.
OBJECTIVE ATTEMPTS AND ROUND OUTCOMES
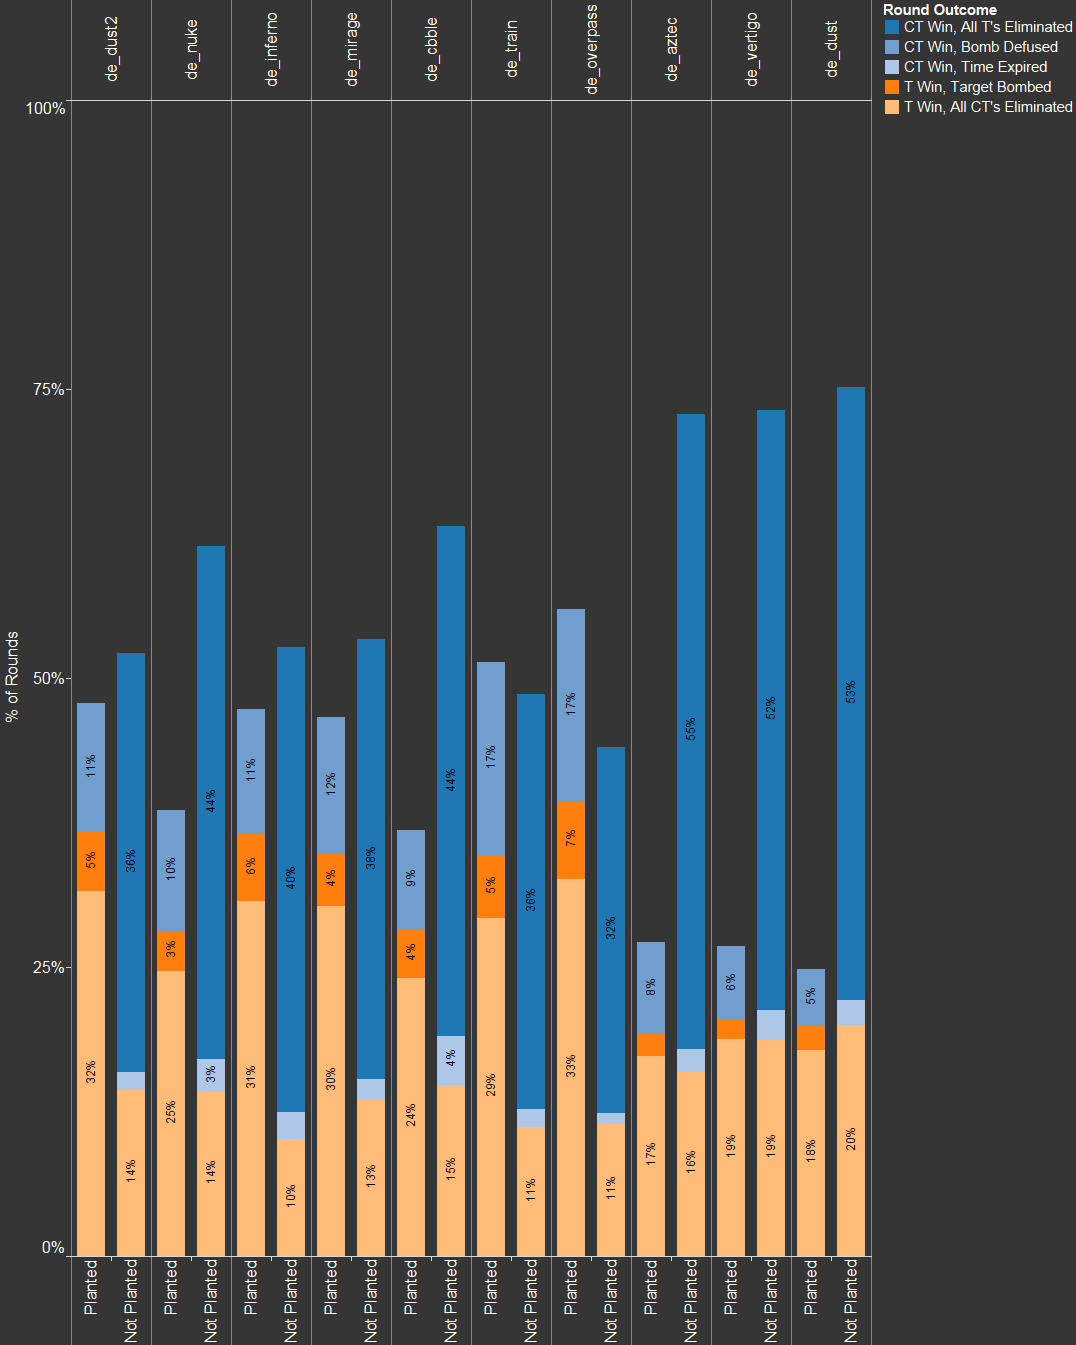
Overall round outcomes don’t tell us much about what happens in an individual round. To find out how the T and CT side got their wins, we can break down rounds based on whether or not a bomb was planted.
Click here for a full dataset that breaks down each map by skill group.
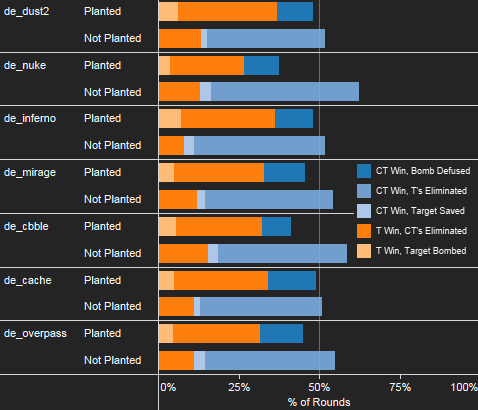
And now some differences emerge. Dust2 and Cache still look fairly similar, the bomb is planted in nearly half of all rounds, though CTs tend to defuse more often in Cache. In Cobblestone, the bomb is planted far less frequently (in this respect, Cobblestone is more similar to Nuke), but is protected by the T-side very effectively.
We’ll continue to share data as we make further adjustments to maps in CS:GO. Take a look, and let us know what you think!


Map Data
2014.01.24 -
Yesterday’s update included adjustments to Cobblestone and Overpass.
As we continue to develop Cobblestone and Overpass, we can use round outcome data to help drive design decisions. How do these new maps compare to other official maps?
For answers to that question and more, click here!
Map Data
2014.01.24 - 
CS:GO Map Data
As we continue to develop Cobblestone and Overpass, we can use round outcome data to help drive design decisions. How do these new maps compare to other official maps?
To answer that question, let’s look at data from the top four skill groups in competitive matchmaking over the period from 12/20/2013 to 1/20/2014.
OVERALL ROUND OUTCOMES
A good place to start is with overall round outcomes. Here are the win percentages for T’s (orange) and CT’s (blue).
For a full dataset with other skill groups and rounds, click here.
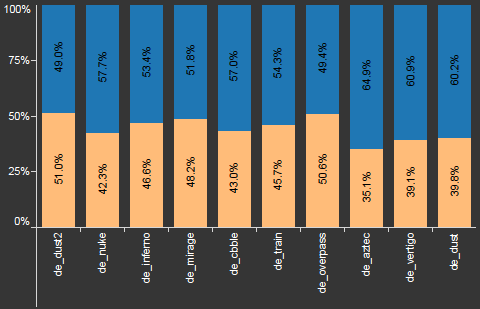
As far as overall round outcomes are concerned, Cobblestone is most comparable to Nuke, while Overpass is similar to Dust2.
OBJECTIVE ATTEMPTS AND ROUND OUTCOMES
Let’s dig deeper! How did the T’s and CT’s get their wins?
For each map, we’ve separated rounds based on whether a bomb was planted, and categorized rounds based on how exactly they ended (e.g., target bombed or bomb defused).
For a full dataset with other skill groups and rounds, click here.
Again, we see similarities between Nuke and Cobblestone – players tend to plant the bomb about as often. However, this graph shows clear differences between Dust2 and Overpass: in Overpass, the bomb is planted far more frequently, but is defused much more often.
As we continue to adjust Cobblestone and Overpass, we’ll be using round outcome data to measure the impact of those changes. We’ll be sharing more data soon, so let us know what you think!
Update: New Matchmaking & Maps
2012.10.01 -
Update (10/11/2012) – We have made some minor fixes and changes to Classic Competitive mode. Click here for release notes.
The Matchmaking update includes two maps (de_vertigo and ar_monastery), a wide range of fixes, and an overhaul of the matchmaking for the Classic Competitive mode.
Matchmaking FAQ
To get you started with the first version of the revamped Classic Competitive mode, here are answers to some common questions about the system:
Heat Maps
2012.04.17 -

Recently we have discussed how we incorporate feedback into our design decisions. In addition to valuable feedback on the forums, another important form of feedback we receive is gameplay data. Our data collection is extensive. We track nearly every player action, from individual bullets fired to weapon purchases, and the resulting data can be used to help us evaluate game design decisions.
A straightforward way to visualize the data we collect is through heat maps. Heat maps can reveal player preferences, choke-points in maps, sight-lines for snipers, and much more.


